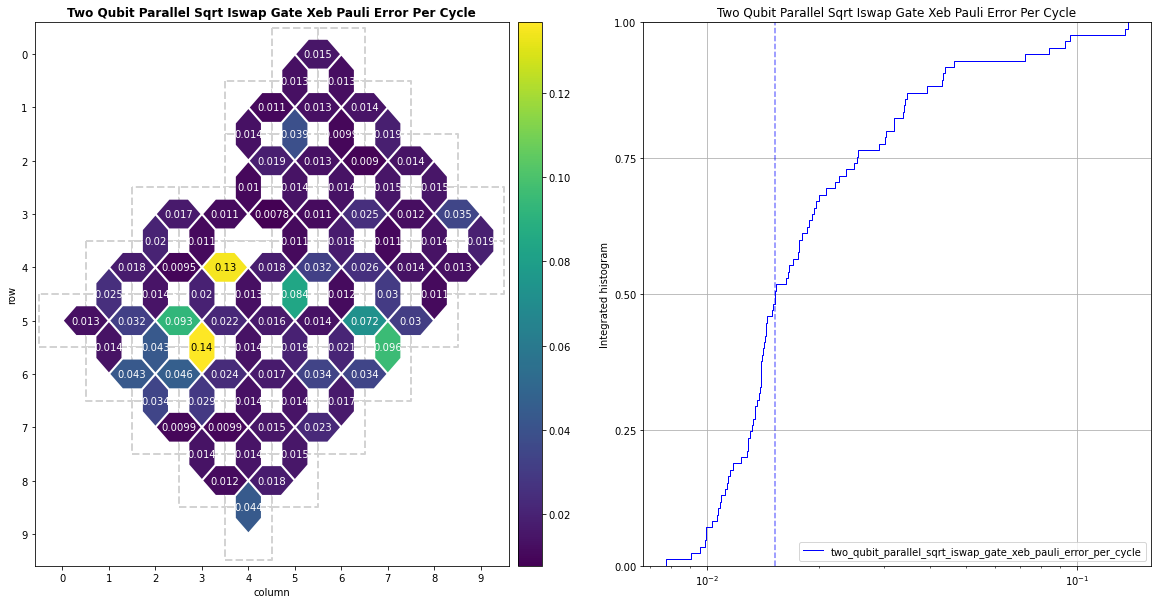
The guide on calibration gives an introduction to calibration metrics and how to retrieve them from the Google Quantum Computing Service (QCS). In this tutorial, we show how to visualize these calibration metrics via single qubit heatmaps, two qubit interaction heatmaps and integrated histograms.
Disclaimer: The calibration metrics of the quantum processor shown in the tutorial do not correspond to actual production metrics.
 View on QuantumAI View on QuantumAI
|
 Run in Google Colab Run in Google Colab
|
 View source on GitHub View source on GitHub
|
|
Setup
# @title Necessary Imports
try:
    import cirq
except ImportError:
    print("installing cirq...")
    !pip install --quiet cirq
    print("installed cirq.")
import cirq
import cirq_google
import os
import matplotlib.pyplot as plt
Authenticate and install Cirq
For details of authentication and installation, please see Get started with Quantum Computing Service.
- Enter the Cloud project ID you'd like to use in the
YOUR_PROJECT_IDfield. - Then run the cell below (and go through the auth flow for access to the project id you entered).

import cirq_google as cg

# The Google Cloud Project id to use.
project_id = ""  # @param {type:"string"}
processor_id = ""  # @param {type:"string"}

from cirq_google.engine.qcs_notebook import get_qcs_objects_for_notebook

device_sampler = get_qcs_objects_for_notebook(project_id, processor_id)

if not device_sampler.signed_in:
    raise Exception(
        "Please setup project_id in this cell or set the `GOOGLE_CLOUD_PROJECT` env var to your project id."
    )
Notebook is not executed with Colab, assuming Application Default Credentials are set up.
Successful authentication to Google Cloud.
# @title Quantum Engine Configuration
# @markdown Replace the `PROCESSOR_ID` and `YOUR_PROJECT_ID` with your details.
PROCESSOR_ID = ''  # @param {type: 'string'}
cals = cirq_google.get_engine_calibration(PROCESSOR_ID, YOUR_PROJECT_ID)
# @title View available calibration metrics
# @markdown See https://quantumai.google/cirq/google/calibration for a description of the available calibration metrics
for k, v in cals.items():
    print(k)
single_qubit_p00_error
single_qubit_p11_error
single_qubit_readout_separation_error
parallel_p00_error
parallel_p11_error
single_qubit_rb_average_error_per_gate
single_qubit_rb_incoherent_error_per_gate
single_qubit_rb_pauli_error_per_gate
single_qubit_idle_t1_micros
two_qubit_sycamore_gate_xeb_average_error_per_cycle
two_qubit_sycamore_gate_xeb_pauli_error_per_cycle
two_qubit_sycamore_gate_xeb_incoherent_error_per_cycle
two_qubit_sqrt_iswap_gate_xeb_average_error_per_cycle
two_qubit_sqrt_iswap_gate_xeb_pauli_error_per_cycle
two_qubit_sqrt_iswap_gate_xeb_incoherent_error_per_cycle
two_qubit_parallel_sycamore_gate_xeb_average_error_per_cycle
two_qubit_parallel_sycamore_gate_xeb_pauli_error_per_cycle
two_qubit_parallel_sycamore_gate_xeb_incoherent_error_per_cycle
two_qubit_parallel_sqrt_iswap_gate_xeb_average_error_per_cycle
two_qubit_parallel_sqrt_iswap_gate_xeb_pauli_error_per_cycle
two_qubit_parallel_sqrt_iswap_gate_xeb_incoherent_error_per_cycle
Metrics
For a complete description of all the available calibration metrics, please see Calibration metrics
Single Qubit Isolated Benchmarking
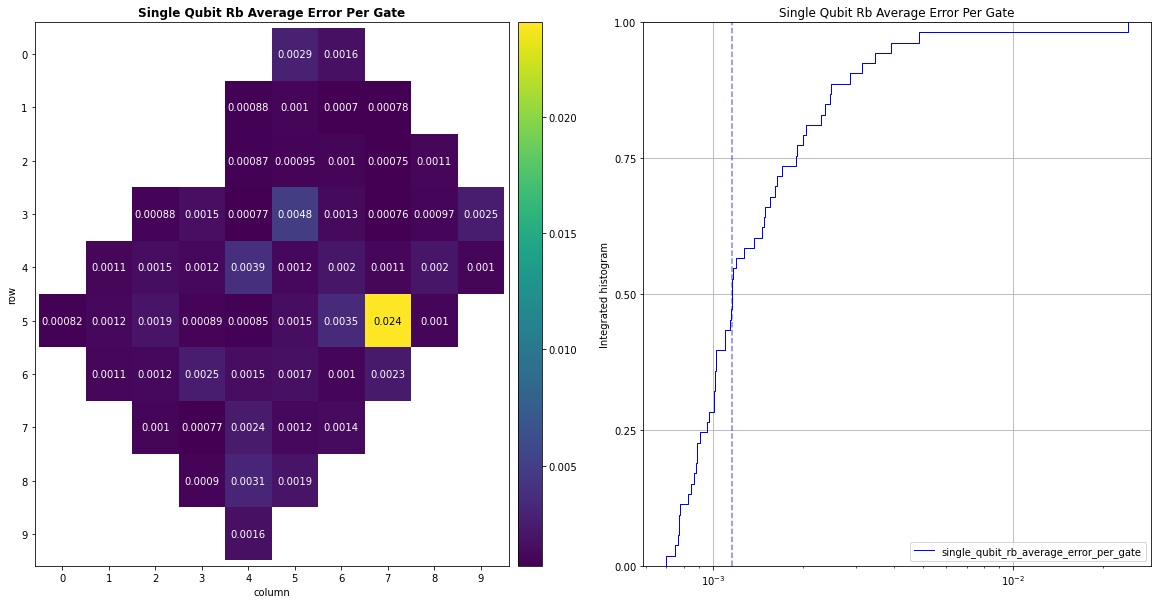
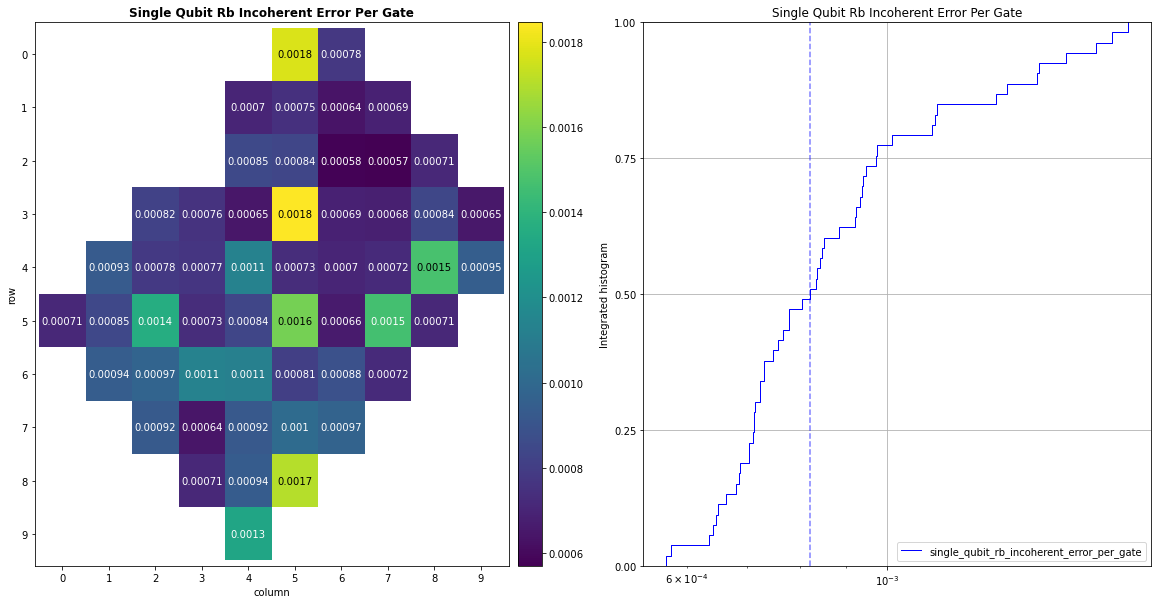
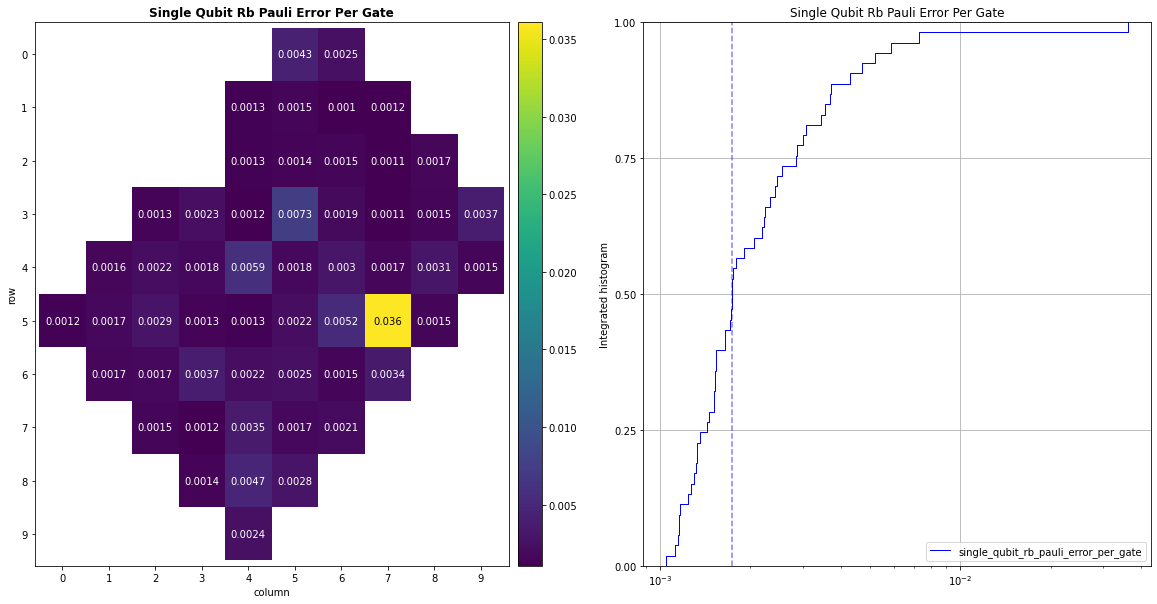
Single qubit gate error is estimated using randomized benchmarking. This error is calculated for one qubit at a time while all other qubits on the device are idle (isolated).
Average Error
Disclaimer: The calibration metrics shown here do not correspond to actual production metrics.
fig, _ = cals.plot('single_qubit_rb_average_error_per_gate', fig=plt.figure(figsize=(20, 10)))
Incoherent Error
Disclaimer: The calibration metrics shown here do not correspond to actual production metrics.
fig, _ = cals.plot('single_qubit_rb_incoherent_error_per_gate', fig=plt.figure(figsize=(20, 10)))
Pauli Error
Disclaimer: The calibration metrics shown here do not correspond to actual production metrics.
fig, _ = cals.plot('single_qubit_rb_pauli_error_per_gate', fig=plt.figure(figsize=(20, 10)))
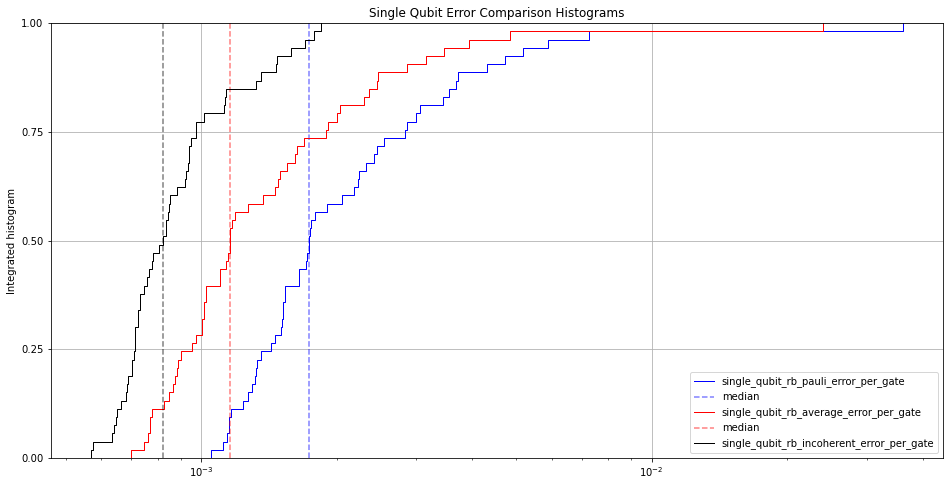
Comparison Histograms
Disclaimer: The calibration metrics shown here do not correspond to actual production metrics.
keys = [
    'single_qubit_rb_pauli_error_per_gate',
    'single_qubit_rb_average_error_per_gate',
    'single_qubit_rb_incoherent_error_per_gate',
]
fig, ax = plt.subplots(figsize=(16, 8))
cals.plot_histograms(keys, ax)
ax.set_title("Single Qubit Error Comparison Histograms")
Text(0.5, 1.0, 'Single Qubit Error Comparison Histograms')
Single Qubit Isolated Readout
The isolated single qubit error is when the readout is measured in isolation (only one qubit is measured at a time).
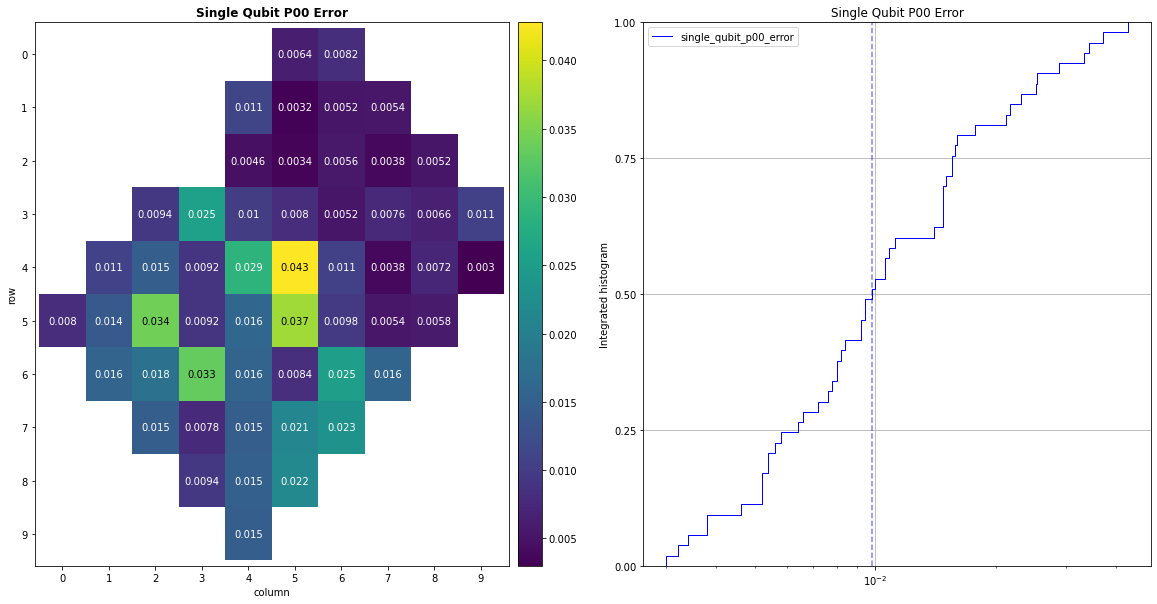
Zero State Errors
Disclaimer: The calibration metrics shown here do not correspond to actual production metrics.
fig, _ = cals.plot('single_qubit_p00_error', fig=plt.figure(figsize=(20, 10)))
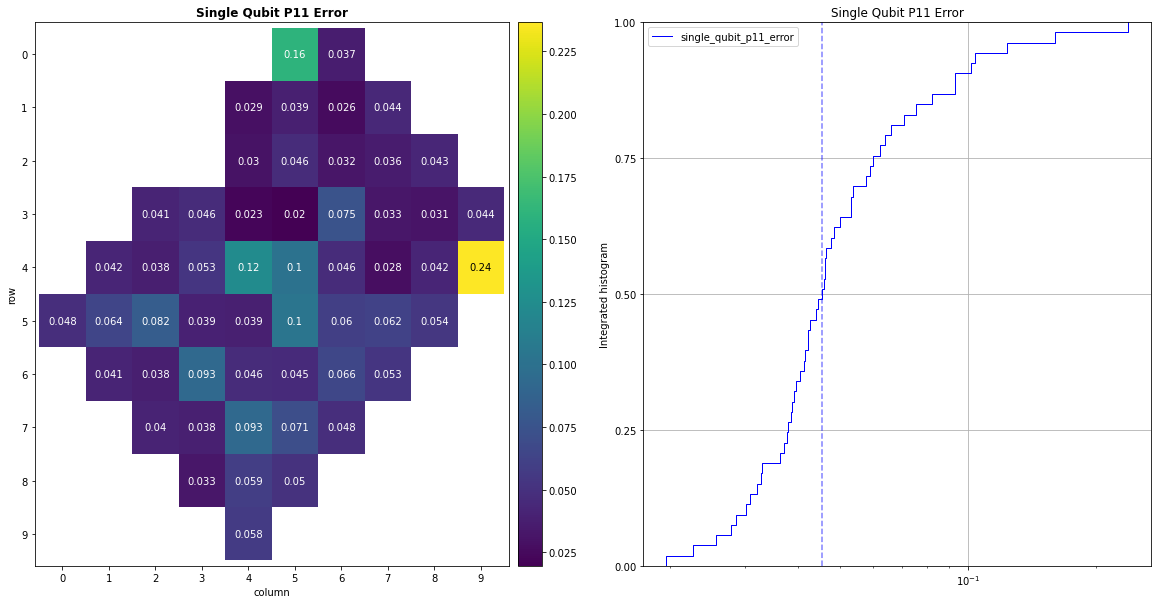
One State Errors
Disclaimer: The calibration metrics shown here do not correspond to actual production metrics.
fig, _ = cals.plot('single_qubit_p11_error', fig=plt.figure(figsize=(20, 10)))
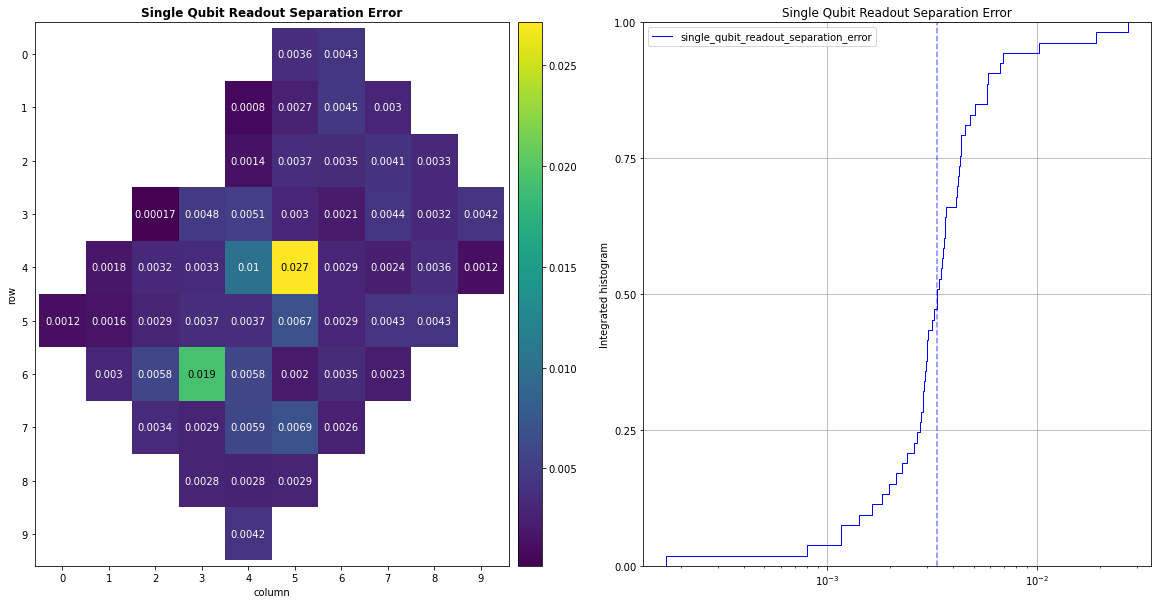
Readout Separation Error
Disclaimer: The calibration metrics shown here do not correspond to actual production metrics.
fig, _ = cals.plot('single_qubit_readout_separation_error', fig=plt.figure(figsize=(20, 10)))
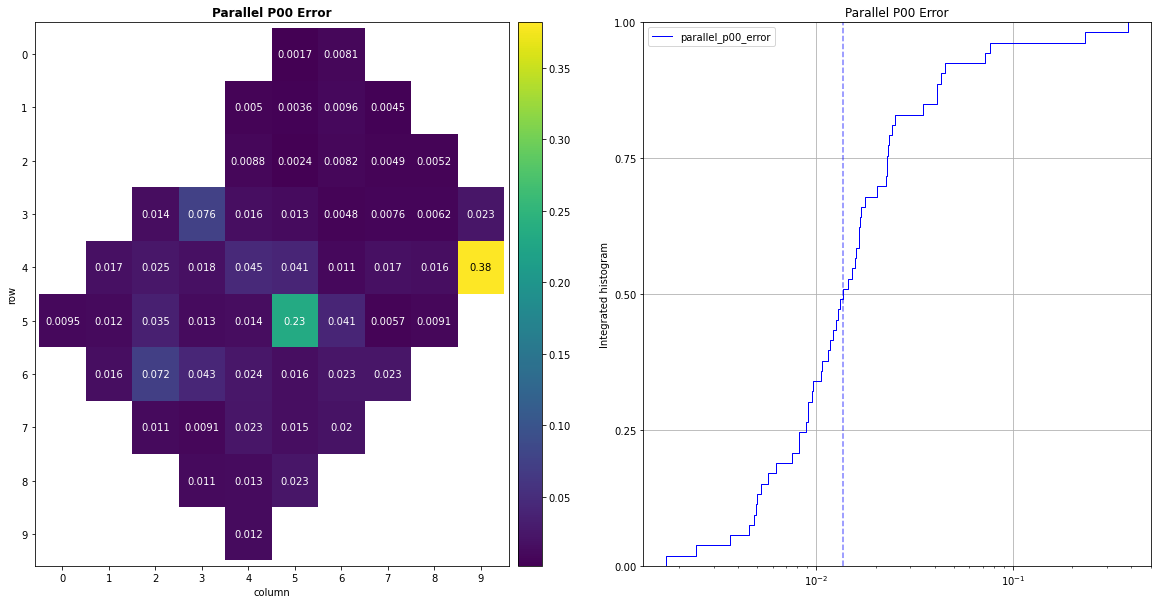
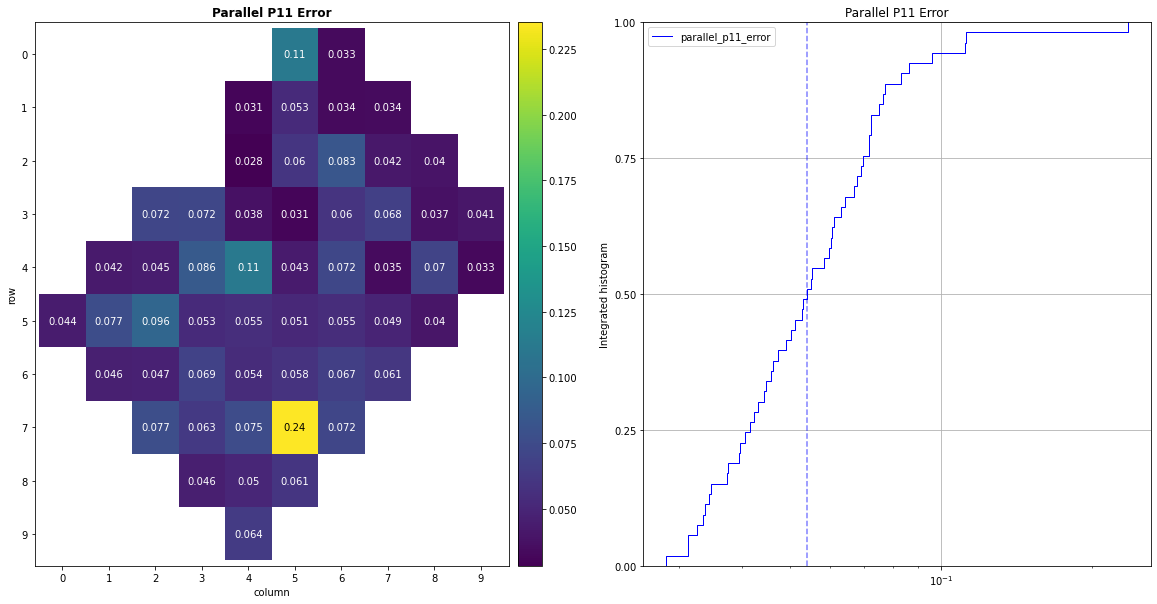
Parallel Readout Error
The parallel single qubit readout error is when the readout for all qubits is measured at the same time.
Parallel P00 Error
Disclaimer: The calibration metrics shown here do not correspond to actual production metrics.
fig, _ = cals.plot('parallel_p00_error', fig=plt.figure(figsize=(20, 10)))
Parallel P11 Error
Disclaimer: The calibration metrics shown here do not correspond to actual production metrics.
fig, _ = cals.plot('parallel_p11_error', fig=plt.figure(figsize=(20, 10)))
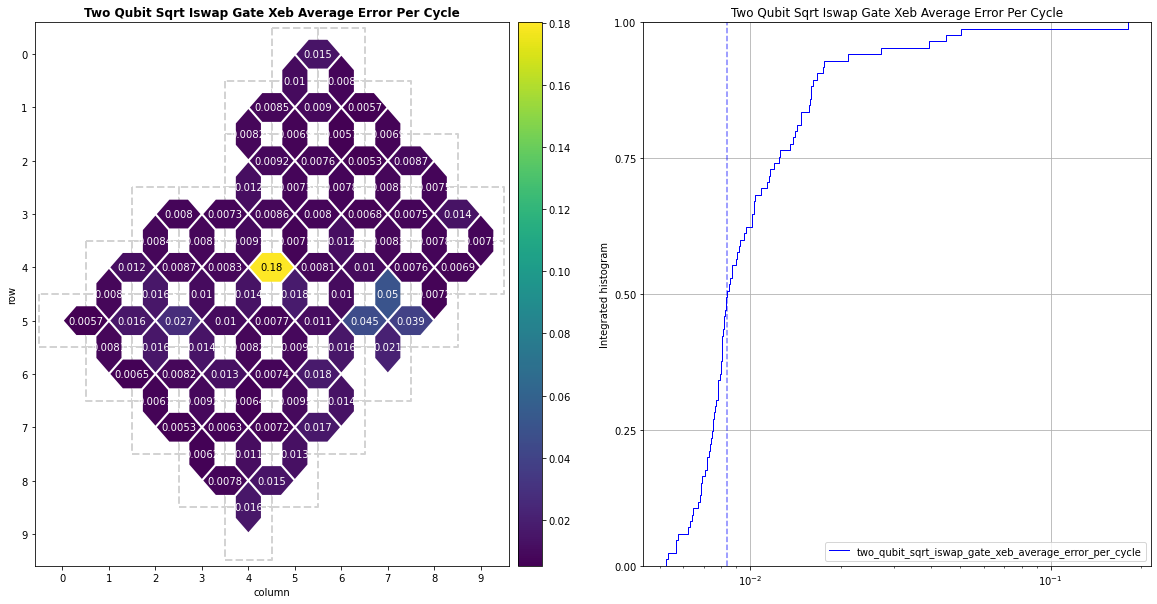
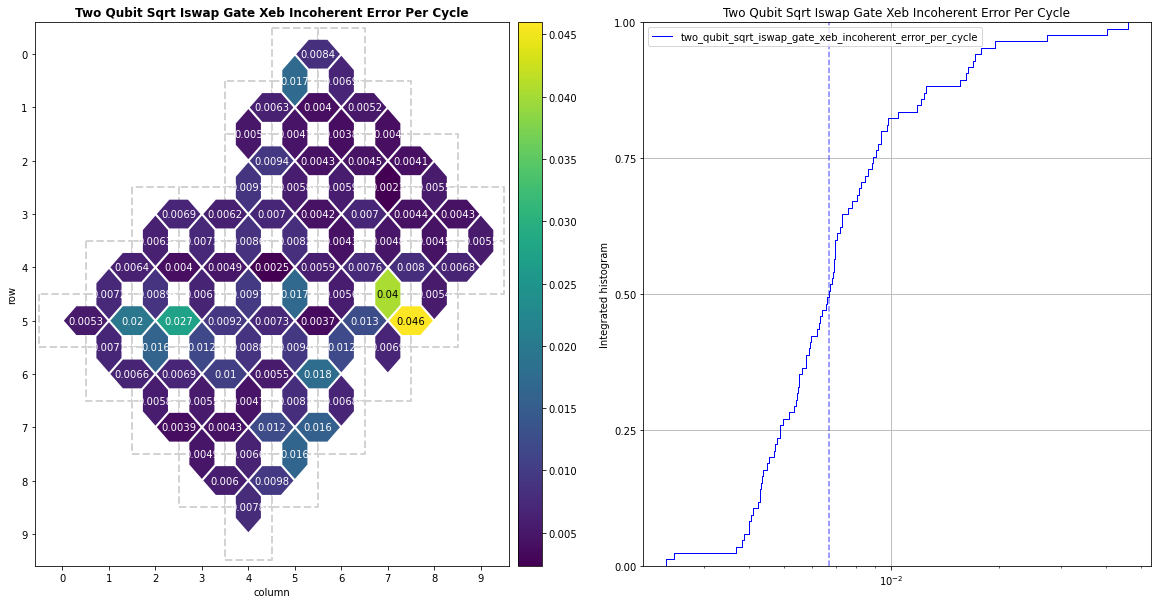
Isolated Pair XEB, sqrt(iswap)
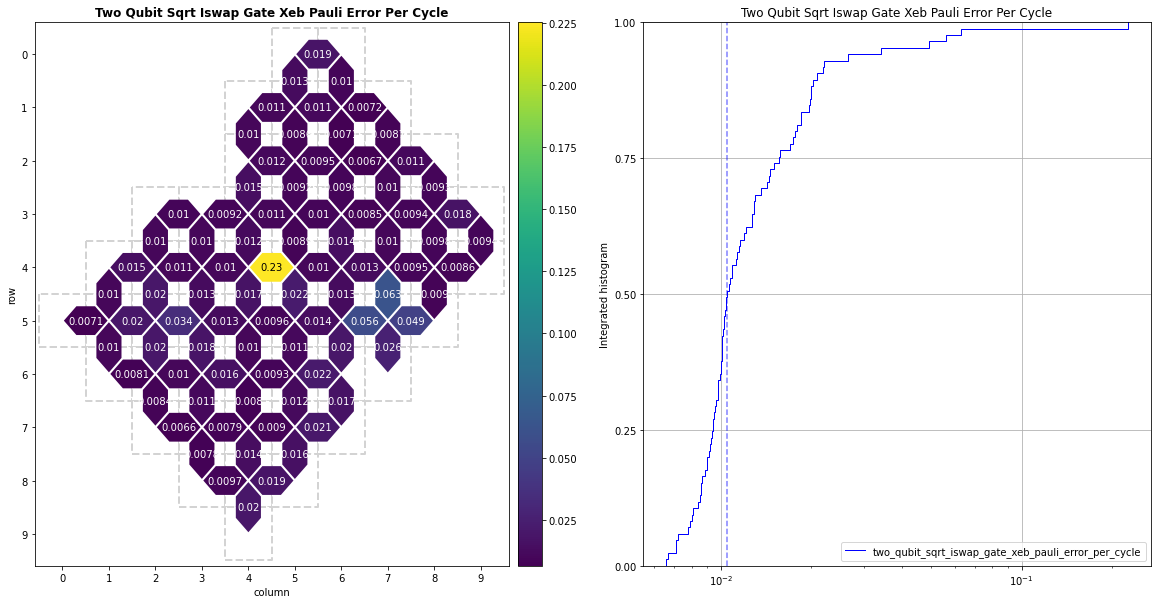
Two qubit error is primarily characterized by applying cross-entropy benchmarking (XEB). These errors are isolated, meaning that, during the metric measurement, only the pair of qubits being considered is active. All other qubits are idle.
Average Error
Disclaimer: The calibration metrics shown here do not correspond to actual production metrics.
fig, _ = cals.plot(
    'two_qubit_sqrt_iswap_gate_xeb_average_error_per_cycle', fig=plt.figure(figsize=(20, 10))
)
Incoherent Error
Disclaimer: The calibration metrics shown here do not correspond to actual production metrics.
fig, _ = cals.plot(
    'two_qubit_sqrt_iswap_gate_xeb_incoherent_error_per_cycle', fig=plt.figure(figsize=(20, 10))
)
Pauli Error
Disclaimer: The calibration metrics shown here do not correspond to actual production metrics.
fig, _ = cals.plot(
    'two_qubit_sqrt_iswap_gate_xeb_pauli_error_per_cycle', fig=plt.figure(figsize=(20, 10))
)
Parallel Pair XEB, sqrt(iswap)
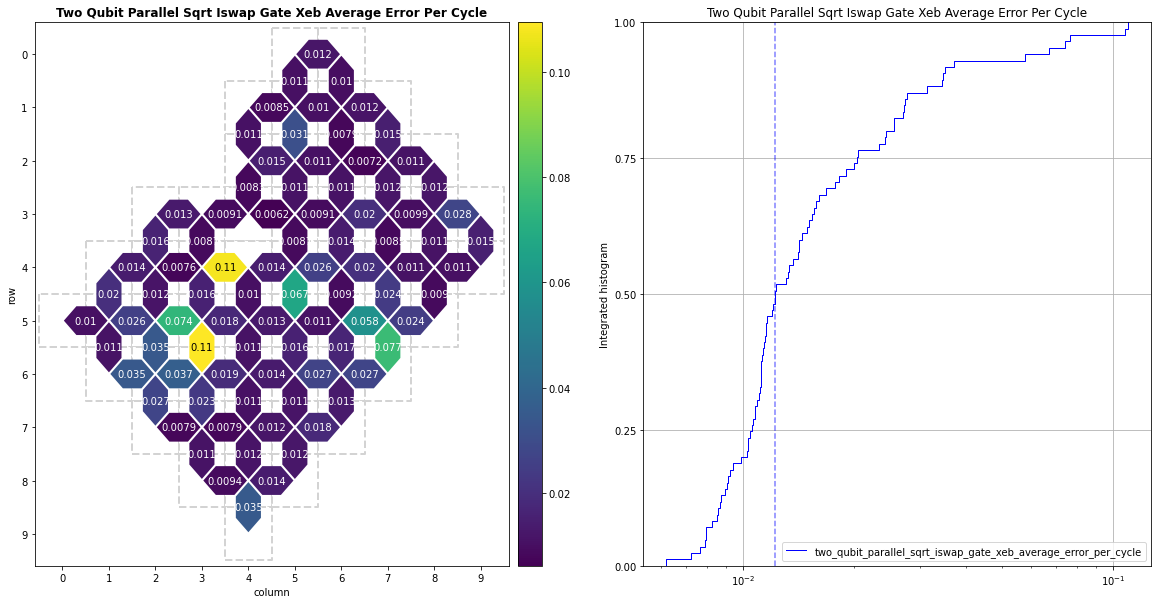
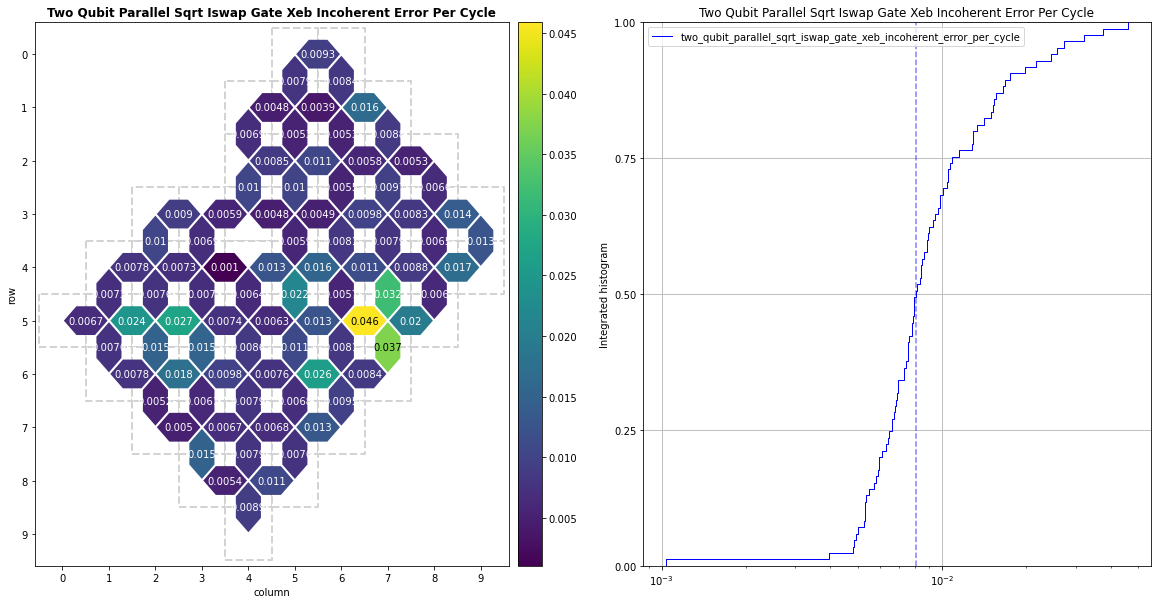
These metrics are calculated the same way as the 2-qubit isolated XEB error metrics. However, this metric quantifies the error of multiple parallel 2-qubit cycles at a time.
Average Error
Disclaimer: The calibration metrics shown here do not correspond to actual production metrics.
fig, _ = cals.plot(
    'two_qubit_parallel_sqrt_iswap_gate_xeb_average_error_per_cycle',
    fig=plt.figure(figsize=(20, 10)),
)
Incoherent Error
Disclaimer: The calibration metrics shown here do not correspond to actual production metrics.
fig, _ = cals.plot(
    'two_qubit_parallel_sqrt_iswap_gate_xeb_incoherent_error_per_cycle',
    fig=plt.figure(figsize=(20, 10)),
)
Pauli Error
Disclaimer: The calibration metrics shown here do not correspond to actual production metrics.
fig, _ = cals.plot(
    'two_qubit_parallel_sqrt_iswap_gate_xeb_pauli_error_per_cycle', fig=plt.figure(figsize=(20, 10))
)
