State Histograms are useful to visualize the output of running a quantum circuit. For details on how to create and run your own quantum circuits, please see Cirq basics
|
|
|
|
|
try:
    import cirq
except ImportError:
    print("installing cirq...")
    !pip install --quiet cirq
    print("installed cirq.")
    import cirq
import matplotlib.pyplot as plt
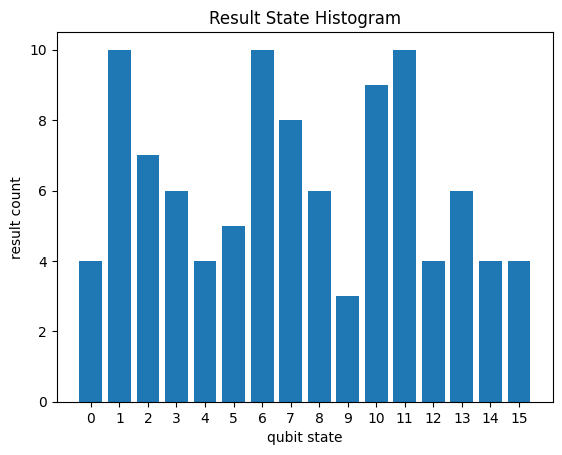
Basic usage
q = cirq.LineQubit.range(4)
circuit = cirq.Circuit([cirq.H.on_each(*q), cirq.measure(*q)])
result = cirq.Simulator().run(circuit, repetitions=100)
_ = cirq.plot_state_histogram(result, plt.subplot())
plt.show()
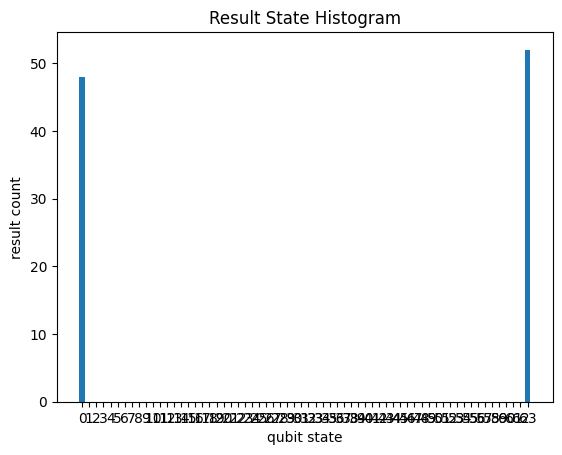
Plotting circuits with sparse output
If the results have sparse output, you can use the result.histogram to compute the histogram and plot only states that have non-zero sample count. For example:
Default plot
The default call to cirq.plot_state_histogram would plot all possible output states (including 0's). This can get messy, especially if the output is sparse.
q = cirq.LineQubit.range(6)
circuit = cirq.Circuit(
    [
        cirq.H(q[0]),
        [cirq.CNOT(q[0], q[i]) for i in range(1, 6, 1)],
        cirq.measure(*q, key='measure_all'),
    ]
)
result = cirq.Simulator().run(circuit, repetitions=100)
_ = cirq.plot_state_histogram(result, plt.subplot())
plt.show()
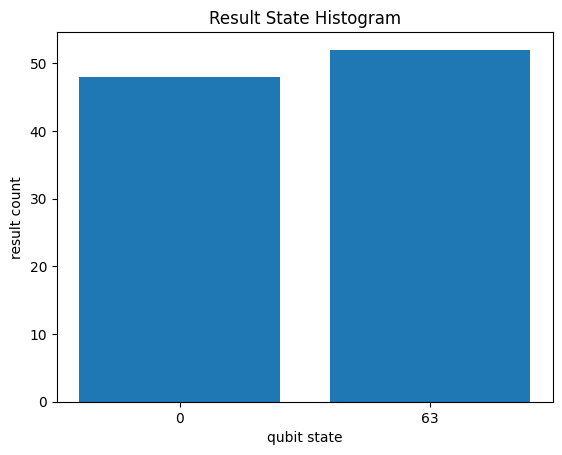
Sparse plots
To plot only non-zero entries in the histogram, you can first compute a histogram using result.histogram() and pass its result to cirq.plot_state_histogram
histogram = result.histogram(key='measure_all')
_ = cirq.plot_state_histogram(histogram, plt.subplot())
plt.show()
Histogram for processed results.
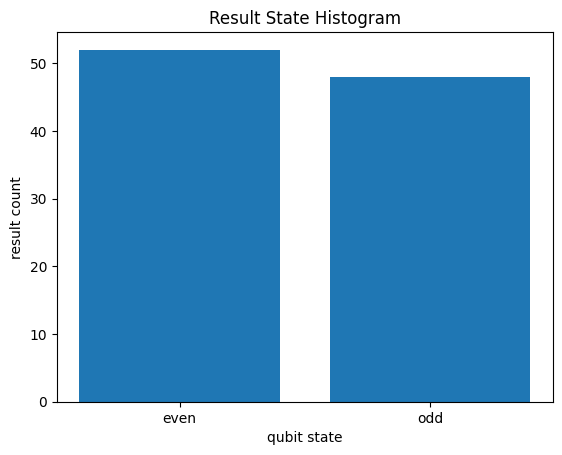
result.histogram() also allows you to pass a fold_func parameter that can be used to process the sampled measurement results and convert to a countable value to generate a histogram.
As an example, suppose you want to plot a histogram of the parity of the number of times a 1 occurs in a measurement result. We can do this using fold_func as follows:
def count_ones(bits):
    return 'even' if sum(bits) % 2 == 0 else 'odd'


q = cirq.LineQubit.range(6)
# Uniform superposition over all 2 ** 6 states.
circuit = cirq.Circuit([cirq.H.on_each(*q), cirq.measure(*q, key='measure_all')])
result = cirq.Simulator().run(circuit, repetitions=100)
# Create a customized histogram by processing the measurement results using `fold_func`.
custom_histogram = result.histogram(key='measure_all', fold_func=count_ones)
# Plot the custom histogram using cirq.plot_state_histogram
_ = cirq.plot_state_histogram(custom_histogram, plt.subplot())
plt.show()
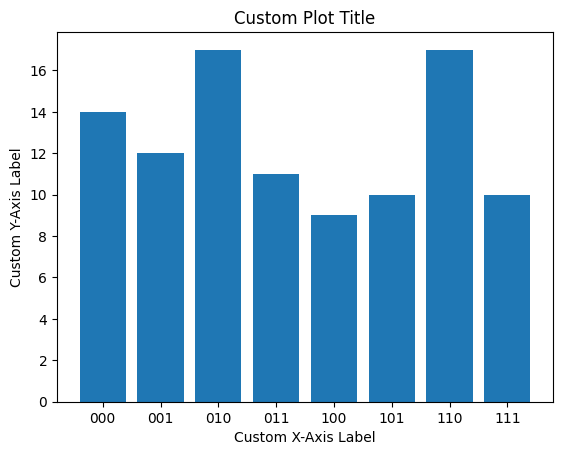
Modifying plot properties
You can pass additional arguments to the cirq.plot_state_histogram method to modify plot properties like title, xlabel, ylabel and tick_label. For example:
def binary_labels(num_qubits):
    return [bin(x)[2:].zfill(num_qubits) for x in range(2**num_qubits)]


q = cirq.LineQubit.range(3)
circuit = cirq.Circuit([cirq.H.on_each(*q), cirq.measure(*q)])
result = cirq.Simulator().run(circuit, repetitions=100)
_ = cirq.plot_state_histogram(
    result,
    plt.subplot(),
    title='Custom Plot Title',
    xlabel='Custom X-Axis Label',
    ylabel='Custom Y-Axis Label',
    tick_label=binary_labels(3),
)
plt.show()