
|
|
|
|
|
Qubit heatmaps are primarily used for visualizing calibration metrics but can be used for any custom data. This tutorial shows how you can create a cirq.Heatmap for single-qubit data and a cirq.TwoQubitInteractionHeatmap for two-qubit data.
try:
    import cirq
except ImportError:
    print("installing cirq...")
    !pip install --quiet cirq
    print("installed cirq.")
    import cirq

import matplotlib.pyplot as plt
Basic usage
Heatmaps maintain an internal state of configuration parameters based on the kwargs passed to the constructor, for example: plot_colorbar=False to hide the colorbar. For full details on the valid set of parameters, please see the cirq.Heatmap reference page.
The internal state can also be updated after construction by passing a valid set of kwargs to heatmap.update_config(**kwargs).
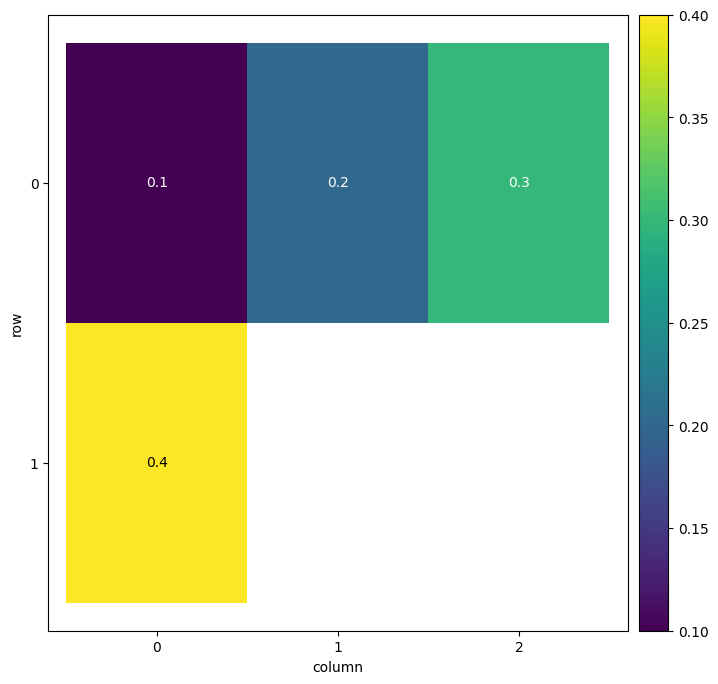
Single-qubit heatmaps
You can directly create heatmaps using custom data mapping from a grid qubit tuple (single qubit or qubit pair) to a corresponding float value.
A single-qubit heatmap example is shown below.
single_qubit_heatmap = cirq.Heatmap(
    {
        (cirq.GridQubit(0, 0),): 0.1,
        (cirq.GridQubit(0, 1),): 0.2,
        (cirq.GridQubit(0, 2),): 0.3,
        (cirq.GridQubit(1, 0),): 0.4,
    }
)

_, ax = plt.subplots(figsize=(8, 8))
_ = single_qubit_heatmap.plot(ax);
Two-qubit heatmaps
You can create Two-qubit heatmaps in an analogous manner using tuples of qubit pairs and corresponding (float) data values.
two_qubit_interaction_heatmap = cirq.TwoQubitInteractionHeatmap(
    {
        (cirq.GridQubit(0, 0), cirq.GridQubit(0, 1)): 0.1,
        (cirq.GridQubit(0, 1), cirq.GridQubit(0, 2)): 0.2,
        (cirq.GridQubit(1, 0), cirq.GridQubit(0, 0)): 0.3,
        (cirq.GridQubit(3, 3), cirq.GridQubit(3, 2)): 0.9,
    },
    annotation_format="0.2f",
    title='Example Two-Qubit Heatmap',
)

_, ax = plt.subplots(figsize=(8, 8))
_ = two_qubit_interaction_heatmap.plot(ax)
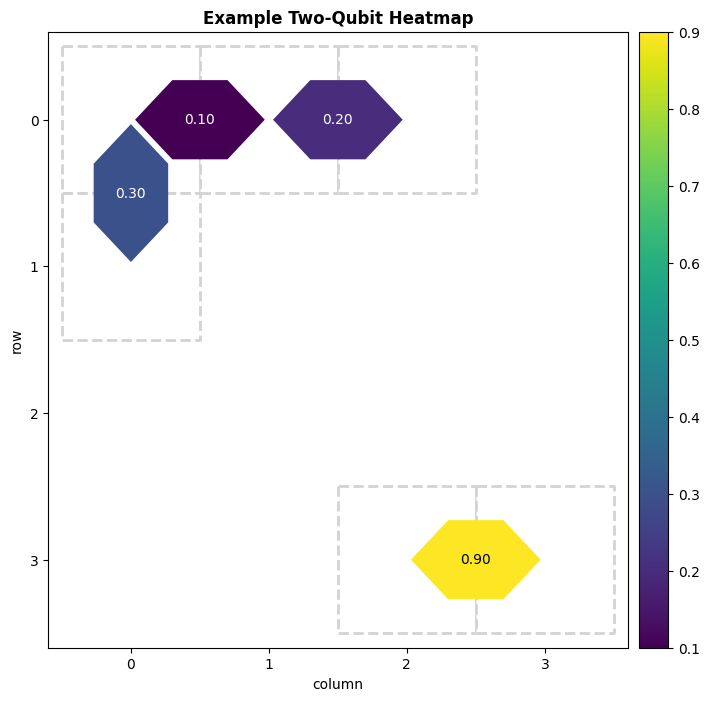
These types of plots are used for visualizing two-qubit calibration metrics.
Heatmap configurations
You can also pass a valid set of config parameters to the heatmap.plot(ax, **kwargs) function, which would temporarily update the internal config based on the parameter values passed as kwargs.
Below, you can see some examples of useful config parameters for the heatmaps.
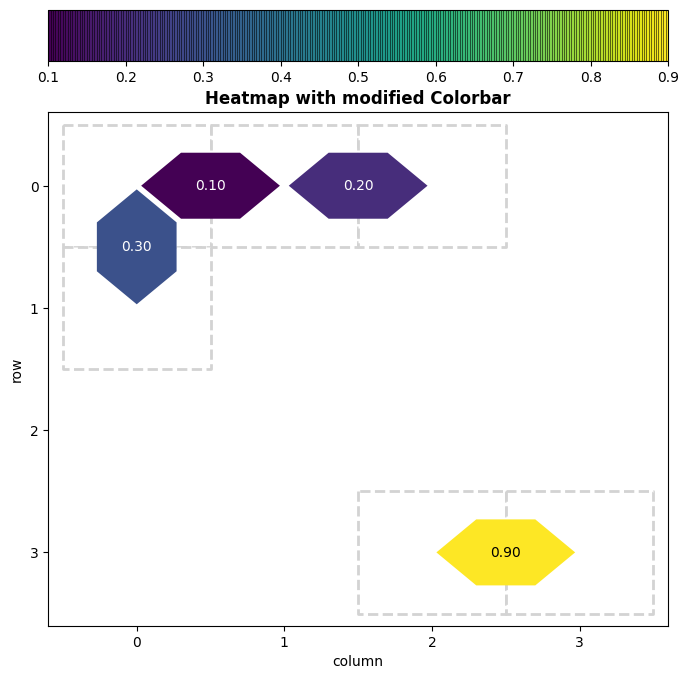
Colorbar Properties
_, ax = plt.subplots(figsize=(8, 8))
_ = two_qubit_interaction_heatmap.plot(
    ax,
    title='Heatmap with modified Colorbar',
    plot_colorbar=True,
    colorbar_position='top',
    colorbar_size='10%',
    colorbar_pad='10%',
    colorbar_options={'drawedges': True},
)
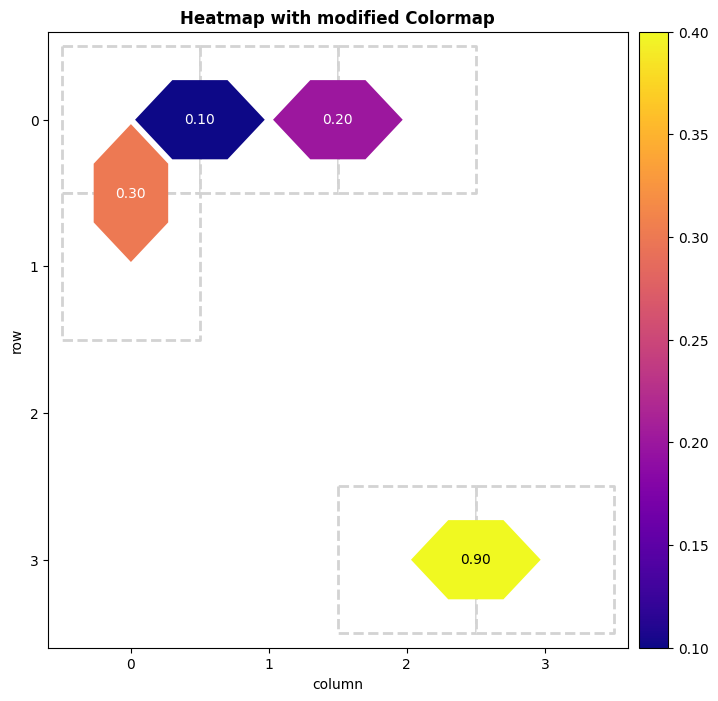
Colormap properties
_, ax = plt.subplots(figsize=(8, 8))
_ = two_qubit_interaction_heatmap.plot(
    ax,
    title='Heatmap with modified Colormap',
    vmin=0.1,
    vmax=0.4,
    collection_options={'cmap': 'plasma'},
)
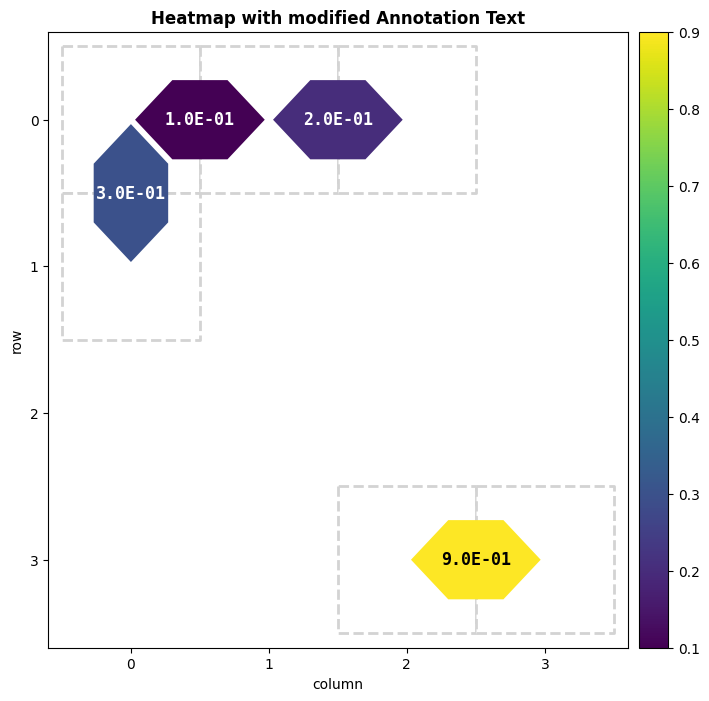
Annotation text properties
_, ax = plt.subplots(figsize=(8, 8))
_ = two_qubit_interaction_heatmap.plot(
    ax,
    title='Heatmap with modified Annotation Text',
    annotation_format='.1E',
    annotation_text_kwargs={'family': 'monospace', 'size': 'large', 'weight': 'bold'},
)
PolyCollection properties
You can modify the properties of the polygons representing the single qubit vertices / two-qubit interaction edges by passing keyword arguments to collection_options, which will get forwarded as **kwargs to matplotlib.collections.PolyCollection.
For example: You can specify a color or a list of colors (corresponding to each polygon) as the value for key edgecolors to modify the edge colors of the polygons.
_, ax = plt.subplots(figsize=(8, 8))
_ = two_qubit_interaction_heatmap.plot(
    ax,
    title='Heatmap with modified PolyCollection',
    collection_options={'edgecolors': ('red', 'blue', 'blue', 'red'), 'linewidths': 5},
)
